Perioperative optimisation
One of the important factors influencing the preoperative outcome is surgical stress, which leads to increased oxygen demand. An unfavourable outcome is responsible for increased patient stay time and cost for the hospital.
Usually therapeutic intervention is a function of actual hemodynamic impairment (reactive approach). On the contrary, the use of a “goal directed therapy” protocol allows a “proactive” strategy that provides monitoring and optimisation of hemodynamic variables and early intervention in order to prevent hemodynamic impairment. The final aim is to improve tissue oxygen delivery and remove the risk of oxygen depletion from surgical stress. The above has proved to be particularly important in patients with a moderate to high surgical risk.
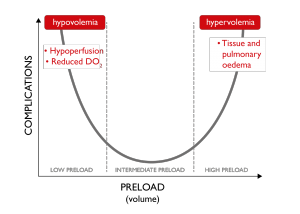
Img. 2 – Classic U-curve
One of the most frequent causes of tissue hypoperfusion is linked to hyper or hypovolemia. In the first case, tissue and pulmonary oedema, in the second case, reduced oxygen delivery, are responsible for organ damage, expressed by the classic U-curve. Adequate venous return to the heart is essential to support optimal Stroke Volume and hence Cardiac Output. Hypovolaemia may be harmful to patients and excessive fluid administration may also be harmful.
GDT-based guidelines recommend the use of functional hemodynamic monitoring and do not recommend the use of static variables (CVP, PAOP) to guide fluid therapy. Dynamic variables PPV, SVV and SPV which are based on heart lung interactions during mechanical ventilation have been shown to be accurate predictors of fluid responsiveness. Fluid responders are patient’s whose CO (or SV) increases > 10-15% after a fluid challenge or passive leg raising.
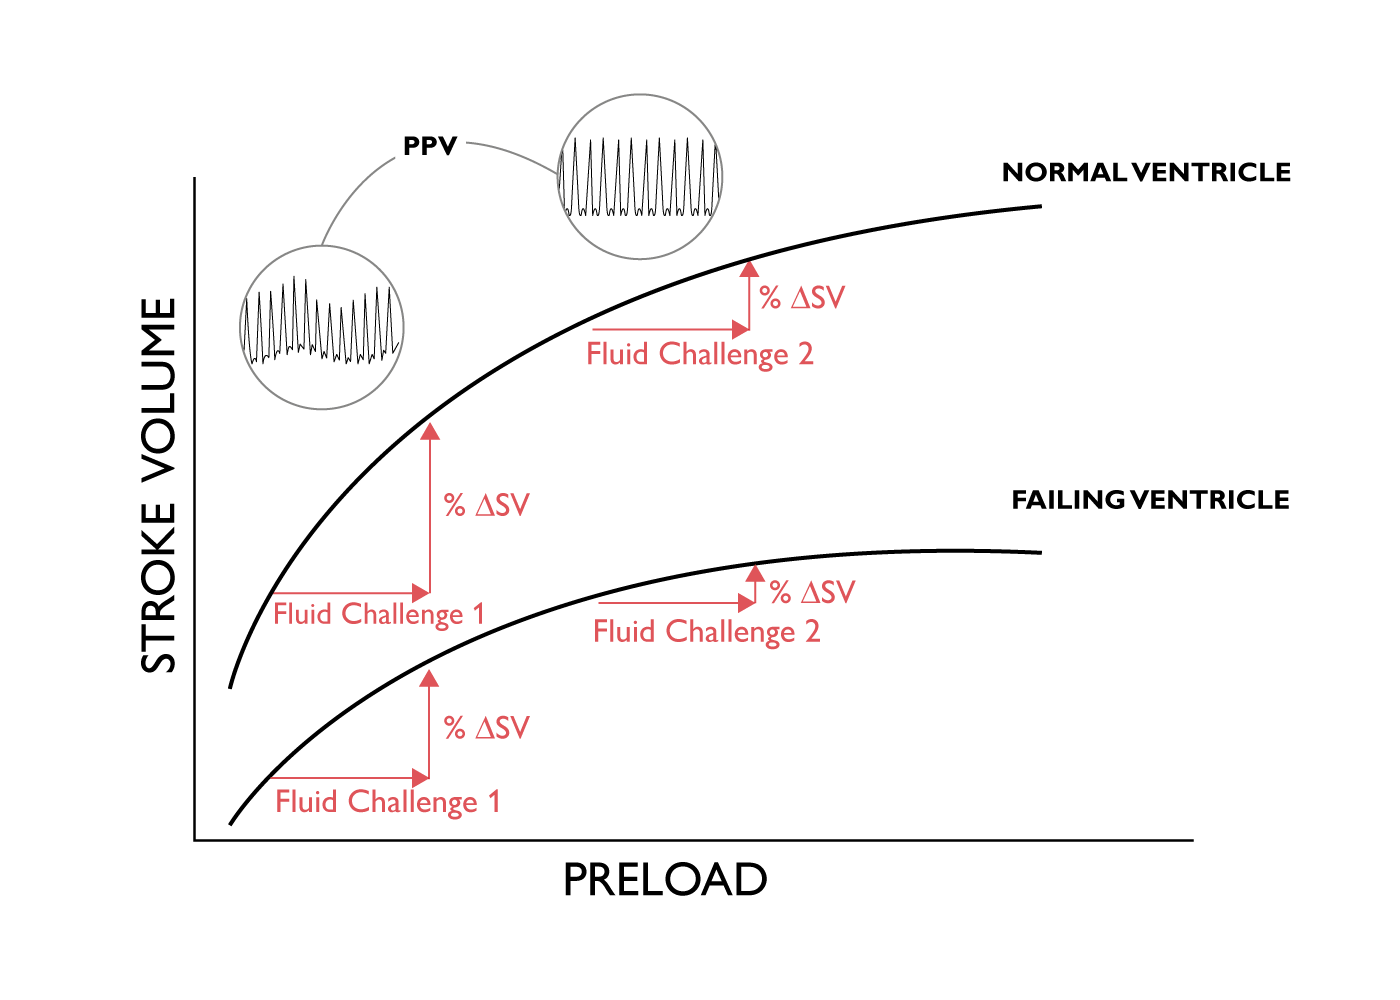 Img. 3 – Frank-Starling curve
 |
The increase in intrathoracic pressure induced by a positive pressure breath during mechanical ventilation induces a change in Pulse Pressure, Stroke Volume and Systolic Pressure when the healthy heart is working in the ascending part of the Frank-Starling Curve. |
PPV is often preferred to SVV because it is measured and not calculated. It is important to appreciate that PPV, SVV and SPV are only validated for use as predictors of fluid responsiveness in specific conditions, including mechanically ventilated patients with no spontaneous breathing and who are in normal sinus rhythm.
When the PPV value is less than 9% administration of fluid is unlikely to lead to an increase in cardiac output (i.e. not fluid responsive). When the PPV is greater than 13% administration of fluid is likely to lead to an increase in CO. (i.e. patient is fluid responsive). When PPV is in the grey zone (9-13%) response to fluid administration cannot be predicted.
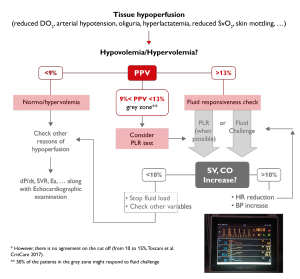
Img. 4 – A typical algorithm of perioperative GDT focused on fluid responsiveness
1. Bellamy MC. Wet, dry or something else? British Journal of Anaesthesia 2006; 97:755-7
2. Jhanji S, Thomas B, Ely A, Watson D, Hinds CJ, Pearse RM. Mortality and utilisation of critical care resources amongst high-risk surgical patients in a large NHS trust. Anaesthesia. 2008 Jul;63(7):695-700
3.Michard F, Chemla D, Teboul JL. Applicability of pulse pressure variation: how many shades of grey? Crit Care 2015; 19(1): 144
4. Giglio M, Manca F, Dalfino L, Brienza N. Perioperative haemodynamic goal-directed therapy and mortality: systematic review and meta-analysis with meta regression. Minerva Anestesiol 2016. 82 (11): 1199-1213
5. Toscani L, Aya HD, Antonakaki D, Bastoni D, Watson X, Arulkumaran N, Rhodes A, Cecconi M. What is the impact of the fluid challenge technique on diagnosis of fluid responsiveness? A systematic review and meta-analysis. Crit Care 2017 Aug 4;21(1):207
6. Brienza N, Biancofiore G, Cavaliere F, Corcione A, De Gasperi A, De Rosa RC, Fumagalli R, Giglio MT, Locatelli A, Lorini FL, Romagnoli S, Scolletta S, Tritapepe L. Clinical guidelines for perioperative hemodynamic management of non cardiac surgical adult patients. Minerva Anestesiol. 2019