User interface
User friendly interface with different colours for an easy identification of the patient information.
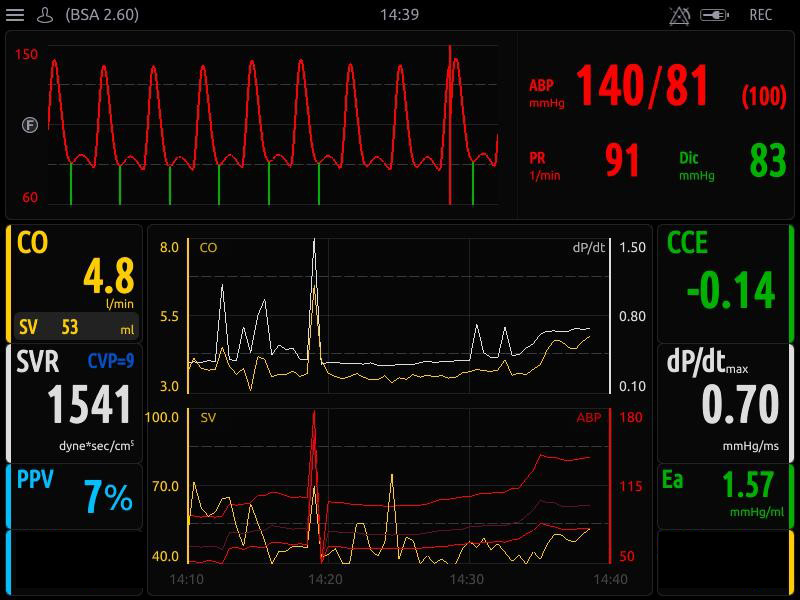
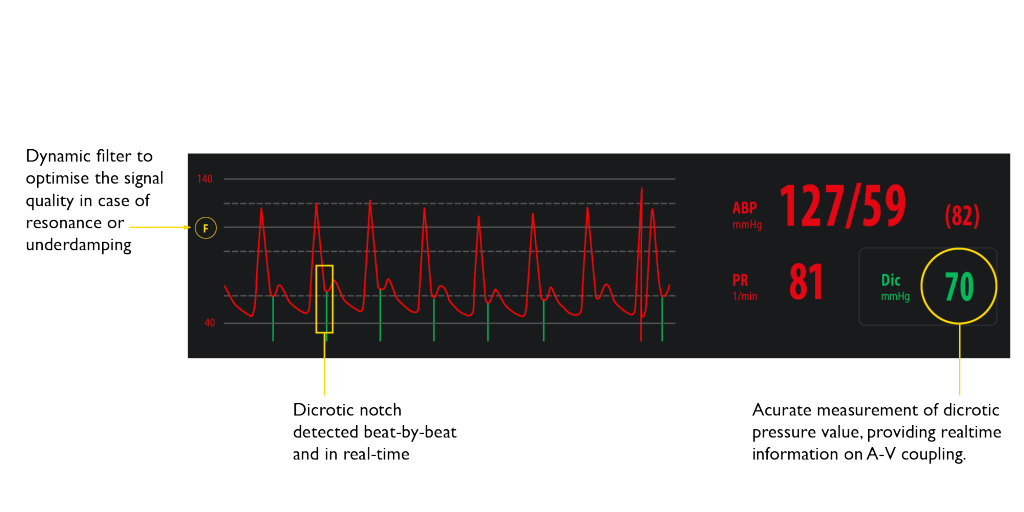
Curves
This area includes the pressure curves relating to the transducers connected to MostCareUp and enables the visualisation of the dicrotic notch, which is indicated by the vertical green line.
When the yellow F is visible the dynamic filter has been automatically activated to remove underdamping from the pressure signal.
If underdamping continues due to circumstances such as high heart rate and or frequency response of the arterial transducer set a manual filter can be activated, which turns the F red.
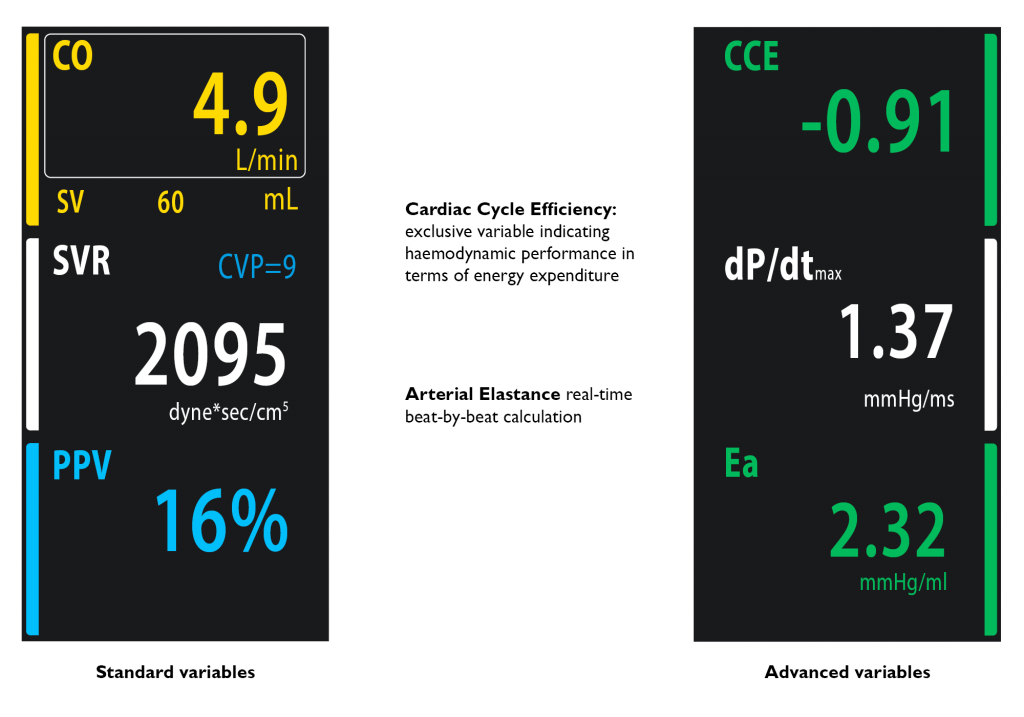
 Variables
Standard and advanced hemodynamic variables are available to provide a complete overview of the patient’s hemodynamic status. Their visualisation on the screen can be customised according to the clinical application.
Click here to get a complete overview of MostCareUp variables and their application.
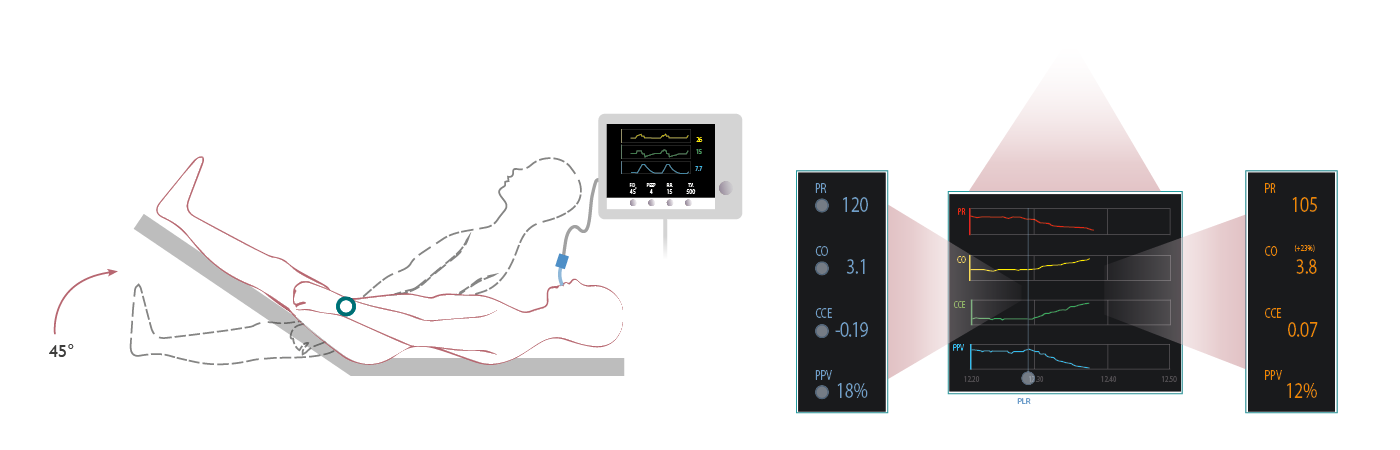
Trends & Markers
The central screen area provides real-time visualisation of multiple patient variables and trending information. Use screen markers to indicate patient interventions to compare variables before and after the intervention.
-
- Trends: select and visualise up to 8 trends simultaneously
- Markers: insert standard and or personalised markers to highlight specific events / therapeutic interventions
- Do & Check function enables the clinician to monitor hemodynamic variations following a specific treatment or drug administration. This includes both fluid challenge and passive leg raise