Standard hemodynamic variables
Pressure and pulse rate
ABP – Arterial Blood Pressure
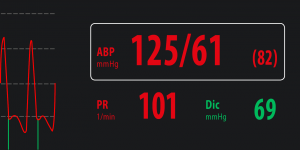 |
PRAM measures systolic pressure as the maximum pressure value during the left ventricular ejection phase and diastolic pressure as the true end-diastolic pressure (not always corresponding to the lowest pressure value in cardiac cycle). Mean arterial pressure is calculated with standard formulas. |
|
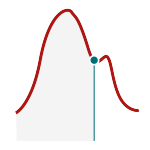
A. Standard wave |
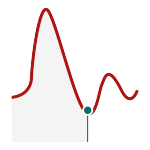
B. Dicrotic pressure lower than diastolic pressure |
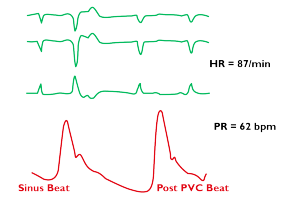
PR – Pulse rate
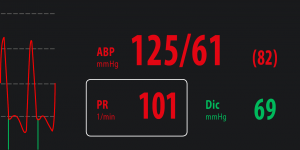 |
Pulse rate is the number of effective heart beats per minute detected from the arterial blood pressure signal. MostCareUp actually gives the number of mechanical pulses, independently from the electrical rate of contraction (e.g. ineffective ectopic beats). |
PP – Pulse Pressure
 |
Pulse pressure is the difference between the systolic and diastolic pressure. PP is a surrogate marker of arterial stiffness, it represents the relationship between left ventricle ejection and vascular status. An increase in PP (for instance > 40 mmHg), when not related to aortic valve insufficiency, may correspond to a reduction of diastolic pressure (reduced vascular tone/resistance) and/or to an increase in systolic pressure related to arterial stiffness or to an increase in the volume ejected (stroke volume). |
1.Dart AM, Kingwell BA. Pulse pressure: a review of mechanisms and clinical relevance. J Am Coll Cardiol. 2001 Mar 15;37(4):975-84.
2.Nawrot TS, Staessen JA, Thijs L, Fagard RH, Tikhonoff V, Wang JG, Franklin SS. ⦁ Should pulse pressure become part of the Framingham risk score? J Hum Hypertens. 2004 Apr;18(4):279-86.
3.Franklin SS. Beyond blood pressure: Arterial stiffness as a new biomarker of cardiovascular disease. J Am Soc Hypertens 2008 May-Jun;2(3):140-51.
4.Safar ME, Plante GE, Mimran A. Arterial stiffness, pulse pressure, and the kidney. Am J Hypertens. 2015 May;28(5):561-9. doi: 10.1093/ajh/hpu206.
5.Al-Khalisy H, Nikiforov I, Jhajj M, Kodali N, Cheriyath P. ⦁ A widened pulse pressure: a potential valuable prognostic indicator of mortality in patients with sepsis. J Community Hosp Intern Med Perspect. 2015 Dec 11;5(6):29426
Flow and perfusion
SV – Stroke Volume
 |
Stroke volume is the amount of blood ejected by the left ventricle in one beat. Physiological range at rest: 60 to 100 mL. |
The use of stroke volume monitoring and optimisation is recommended for perioperative Goal-Directed Therapy (GDT) to improve patient outcomes.
Available also:
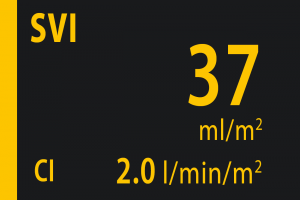
SVI = SV/BSA stroke volume index from 35 to 45 mL/m2
SVkg = SV/weight weighted stroke volume (pediatric use)
1.European Society of Anaesthesiology (ESA, 2016 ) Perioperative Goal-Directed Therapy Protocol Summary.
2.Oscier C, Cecconi M. Goal-directed therapy to maintain haemostasis. Best Pract Res Clin Anaesthesiol. 2016 Jun;30(2):217-28.
CO – Cardiac Output
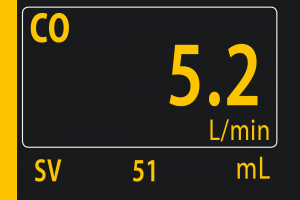 |
Cardiac output is the volume of blood ejected by the left ventricle in one minute. CO = SV x PR Physiological range at rest: 4 – 8 L/min. |
CO determines the blood flow distribution to tissue and organs. Its value is computed from the SV on a beat by beat basis, tracking in real-time the rapid hemodynamic changes.
Available also:
CI = CO/BSA cardiac output index from 2.6 to 3.8 L/min/m2
DO2 – Oxygen Delivery
 |
Oxygen delivery is the amount of oxygen delivered to the tissue over time unit. |
Physiological range at rest: 600-900 mLO2/min.
Oxygen Delivery Index optimisation is recommended for perioperative Goal-Directed Therapy (GDT) to improve patient outcomes.
Available also:
DO2I = CO/BSA·CaO2 Oxygen delivery index from 400 to 600 mL/min/m2
1.Vincent JL, Pelosi P, Pearse R, Payen D, Perel A, Hoeft A, Romagnoli S, Ranieri VM, Ichai C, Forget P, Della Rocca G, Rhodes A. Perioperative cardiovascular monitoring of high-risk patients: a consensus of 12. Crit Care. 2015 May 8;19:224.
2.European Society of Anaesthesiology (ESA, 2016) Perioperative Goal-Directed Therapy Protocol Summary.
2.Saugel B, Vincent JL, Wagner JY. Personalized hemodynamic management. Curr Opin Crit Care. 2017 Aug;23(4):334-341.
Fluid Responsiveness
 |
Dynamic fluid responsiveness variables:
|
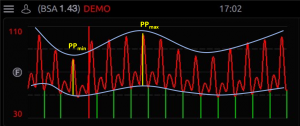
Adequate venous return to the heart is essential to support optimal stroke volume and hence Cardiac Output. Hypovolaemia may be harmful to patients and excessive fluid administration may also be harmful. The traditional static measures of preload (CVP, PAOP) are ineffective in predicting fluid responsiveness (i.e. whether the patient will develop an increase in CO in response to fluid administration).PPV, SVV, and SPV are dynamic variables which are based on heart lung interactions during mechanical ventilation and have been shown to be accurate predictors of fluid responsiveness in mechanically ventilated patients under general anaesthesia or deep sedation.
The increase in intrathoracic pressure induced by a positive pressure breath from the ventilator induces a change in pulse pressure, stroke volume and systolic pressure. PPV, SVV and SPV measure the percentage variations of these variables, in response to ventilation, within a fixed interval of time (15 seconds as a default in MostCareUp). The length of the time interval considered for the calculation of the dynamic variables can be adapted (from 10 to 30 seconds) to the duration of the respiratory cycle, along with a more flexible formula to calculate the values of the dynamic variables.
 |
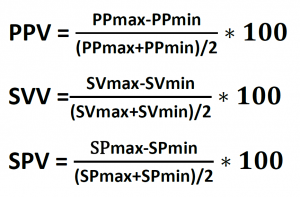 |
PPV is often preferred to SVV because it is measured and not calculated. In addition, PPV demonstrated higher specificity and sensitivity values for predicting fluid responsiveness compared to other dynamic variables.
When PPV value is less than 9% administration of fluid is unlikely to lead to an increase in cardiac output (i.e. not fluid responsive). When the PPV is greater than 13% administration of fluid is likely to lead to an increase in CO. (i.e. patient is fluid responsive). When PPV is in the grey zone (9-13%) response to fluid administration cannot be predicted.
It is important to appreciate that PPV, SVV and SPV are only validated for use as predictors of fluid responsiveness in specific conditions, including mechanically ventilated patients with no spontaneous breathing and who are in normal sinus rhythm. The use of PPV or SVV monitoring and optimisation are recommended for perioperative Goal-Directed Therapy (GDT) to improve patients’ outcomes.
1.Pinsky MR, Payen D. Functional hemodynamic monitoring. Crit Care. 2005.
2.Marik PE, Cavallazzi R, Vasu T, Hirani A. Dynamic changes in arterial waveform derived variables and fluid responsiveness in mechanically ventilated patients: a systematic review of the literature. Crit Care Med. 2009 Sep;37(9):2642-7.
3.Cannesson M, Le Manach Y, Hofer CK, Goarin JP, Lehot JJ, Vallet B, Tavernier B. Assessing the diagnostic accuracy of pulse pressure variations for the prediction of fluid responsiveness: a “gray zone” approach. Anesthesiology. 2011 Aug;115(2):231-41.
4.Vincent JL, Rhodes A, Perel A, Martin GS, Della Rocca G, Vallet B, Pinsky MR, Hofer CK, Teboul JL, de Boode WP, Scolletta S, Vieillard-Baron A, De Backer D, Walley KR, Maggiorini M, Singer M. Clinical review: Update on hemodynamic monitoring–a consensus of 16. Crit Care. 2011 Aug 18;15(4):229.
5.Carsetti A, Cecconi M, Rhodes A. Fluid bolus therapy: monitoring and predicting fluid responsiveness. Curr Opin Crit Care. 2015 Oct;21(5):388-94.
6.European Society of Anaesthesiology (ESA, 2016) Perioperative Goal-Directed Therapy Protocol Summary.
7.Monnet X, Marik PE, Teboul JL. Prediction of fluid responsiveness: an update. Ann Intensive Care. 2016 Dec;6(1):111.
8.Toscani L, Aya HD, Antonakaki D, Bastoni D, Watson X, Arulkumaran N, Rhodes A, Cecconi M. What is the impact of the fluid challenge technique on diagnosis of fluid responsiveness? A systematic review and meta-analysis. Crit Care. 2017;21(1):207.
Afterload
SVR – Systemic Vascular Resistance
 |
Systemic Vascular Resistance is one of the determinants of the left ventricle afterload. SVR = (MAP-CVP) · 80 /CO In MostCareUp the value of central venous pressure (CVP), mandatory for the calculation of SVR, can be entered manually or can be continuously monitored via a central venous line and transducer. |
Physiological range at rest: 800 – 1400 dyne·sec/cm5
As a component of arterial load, SVR will vary with changes in the hemodynamic status of the patient (e.g. septic shock, cardiac failure, hypovolemia).
Available also:
SVRI = (MAP-CVP) / CI SVR index 1600 – 2400 dyne·sec·m2/cm5